City of Boston Property Assessment Data
Source materials
Here is a list with links to the jupyter notebook and original datasets used to generate the findings on this page:
Summary and challenges
The City of Boston’s property assessment records provided data we used to engineer several features for our baseline model. The records used for our analysis can be found here on the Boston Analyze website and included all Boston properties, by Parcel ID (PID) and address, from fiscal years 2013 to 2019. Once consolidated for all these years, the dataset included 1,185,432 total property assessment records as well as 80 different features with which each property was characterized. The largest challenges associated with this data was matching location coordinates to years of data with no recorded location coordinates (approx. 1,083,590 records), as well as identifying which of the 80 features were meaningful enough with minimal missing data for the creation of engineered features for use in our resulting crime prediction model.
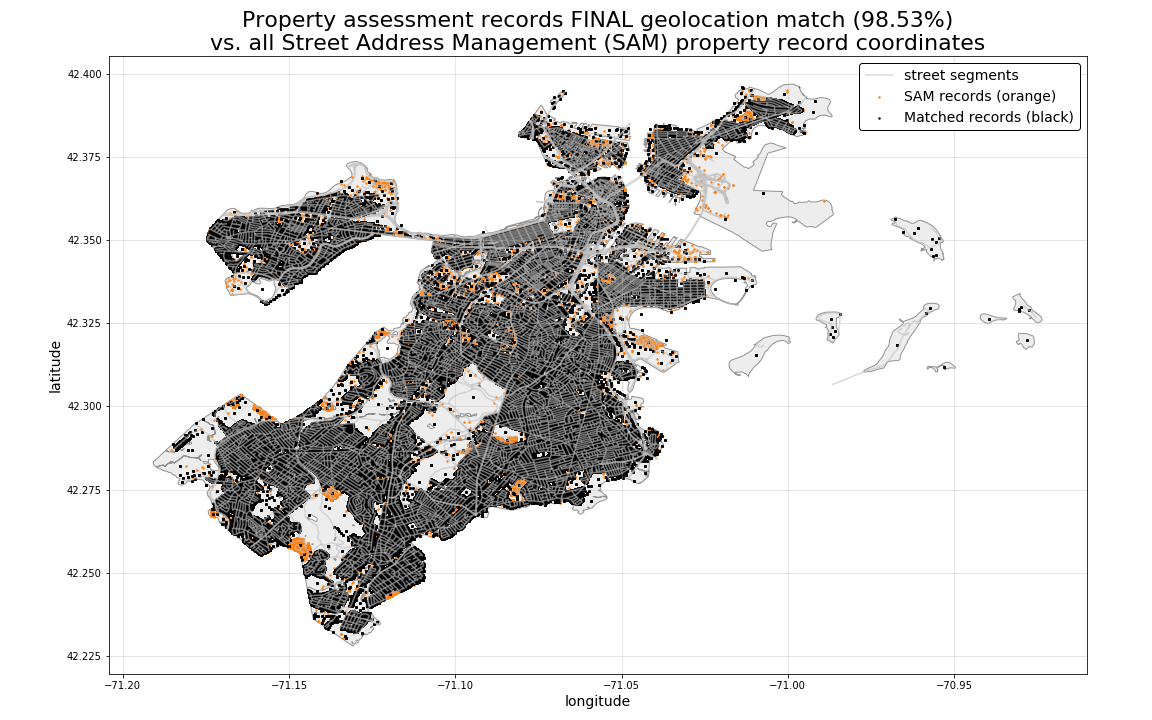
Matching coordinates to records
By matching Parcel IDs (PIDs) for the subset of years with already reported coordinates (only some years included coordinates by default), the vast majority of these missing coordinates were matched. For the remaining 78,018 unmatched records, we turned to the City of Boston’s Live Street Address Management (SAM) System parcel dataset, which can be found here. With the SAM dataset, we were able to match coordinates to all but 32,297 assessment records for a 98.5% total match rate (see plot below). While the plot below indicates that there are still pockets of unmatched SAM property parcels (as indicated by the visible orange points below), the remaining 1.5% unmatched property assessment records lack specific street addresses or any other features which will make matching of those records feasible. While a future iteration of this analysis may provide sufficient time to explore methods for imputing this missing data, it is outside the scope of the current analysis.
Feature engineering
With these matched coordinates, we were able to explore the dataset for features of interest that we could aggregate within geospatial regions. From this, we engineered a set of 10 property-based predictors, each providing a census tract-level metric per-year to give (1) a point-in-time annual measure for that tract-level geographic area, as well as (2) a 3-year compound annual growth rate (CAGR) to measure shifting property demographics for the area.
The full set of census tract-level engineered features derived from the property assessment dataset are listed below. A more in-depth examination of several of these specific features can be found here as part of the EDA conducted on the final training set.
- Median residential property value
- This provides the annual median property value for all residential properties in each census tract.
- Median residential value, 3-year CAGR
- This provides a measure of gentrification/development trend activity in the observation’s census tract area and year of occurrence.
- Median residential property value Gini coefficient
- This feature is used to measure “disparity” or inequality of residential property values within each census tract.
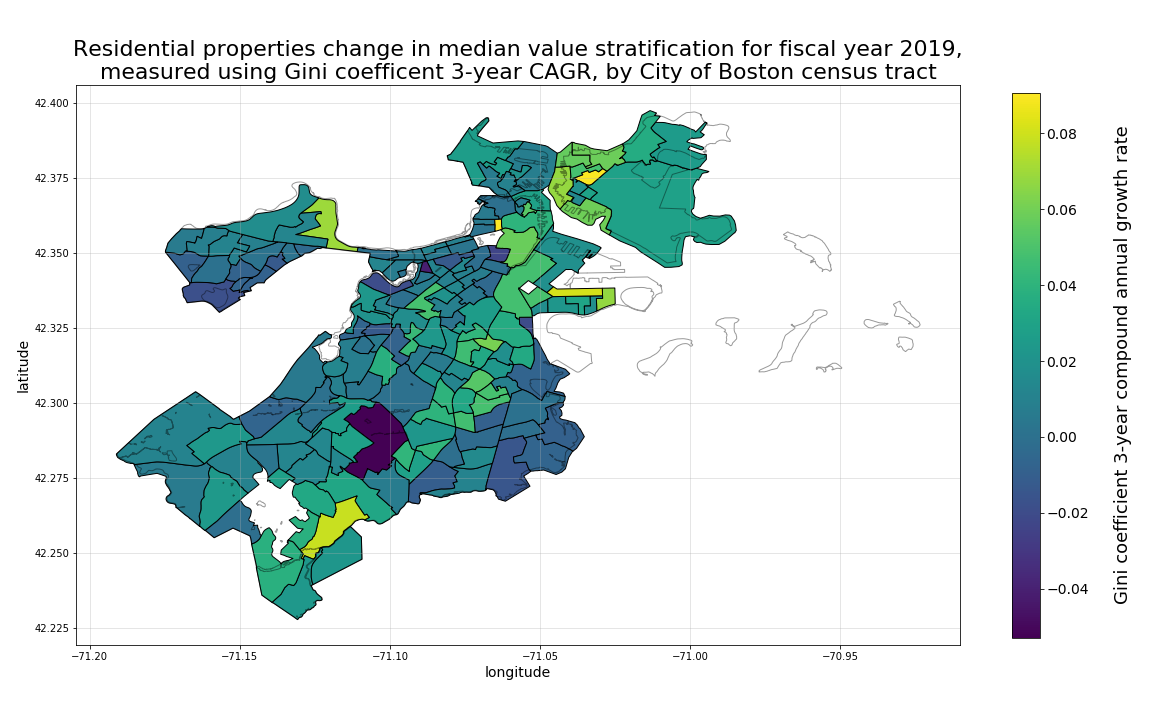
- Median residential property value Gini coefficient, 3-year CAGR
- This provides a measure of growing or shrinking inequality in the observation’s census tract area and year of occurrence.
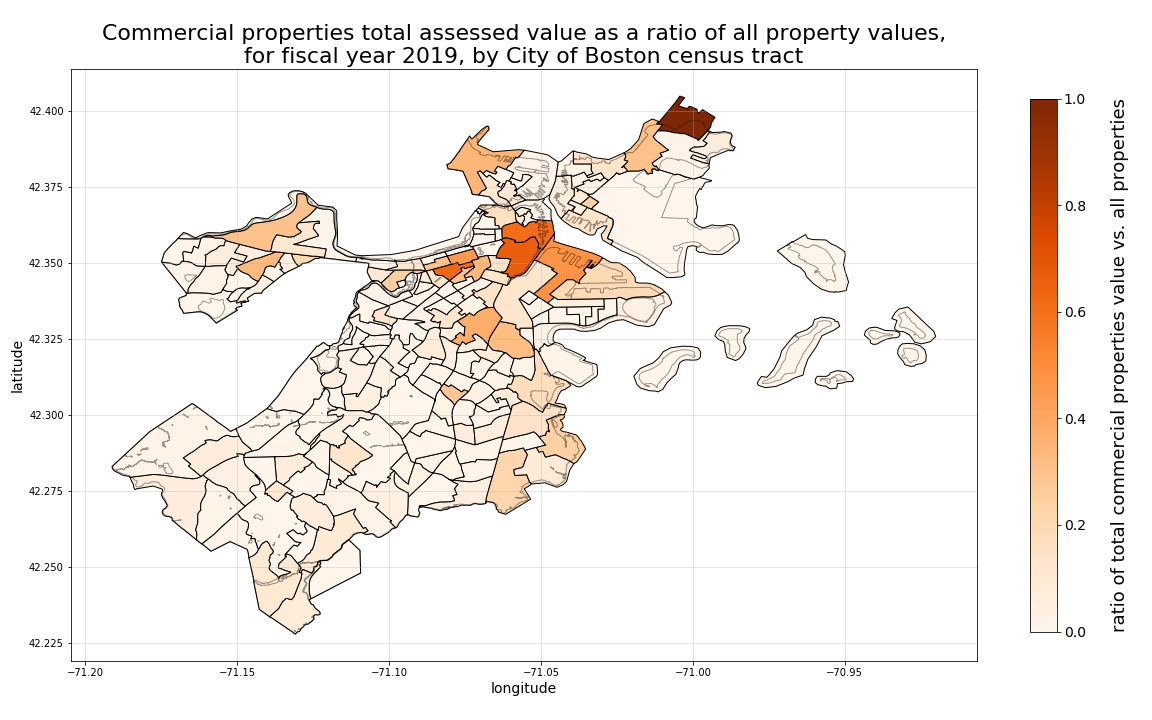
- Commercial properties mix ratio
- This provides a measure as to how “commercial” the corresponding census tract is each year, as measured by total assessed commercial property value in the tract divided by the total assessed value for all property in the tract during the given observation year.
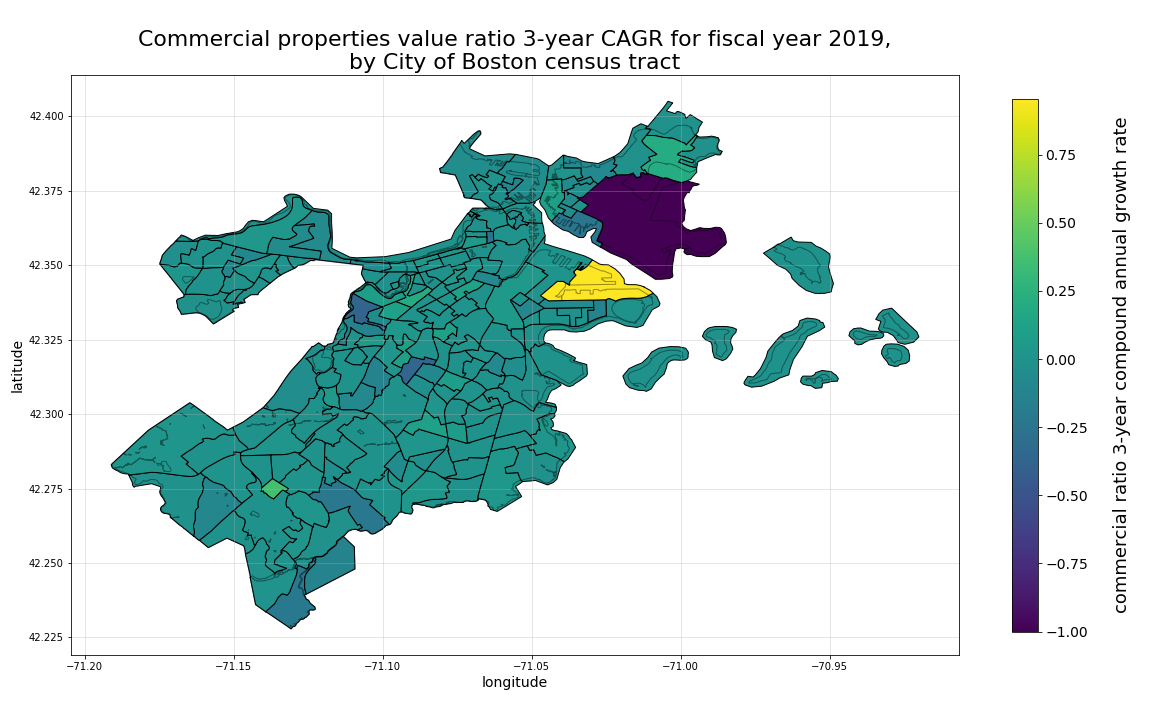
- Commercial properties mix ratio, 3-year CAGR
- This provides a measure of how much more or less commercial the tract is becoming at the time of the observation.
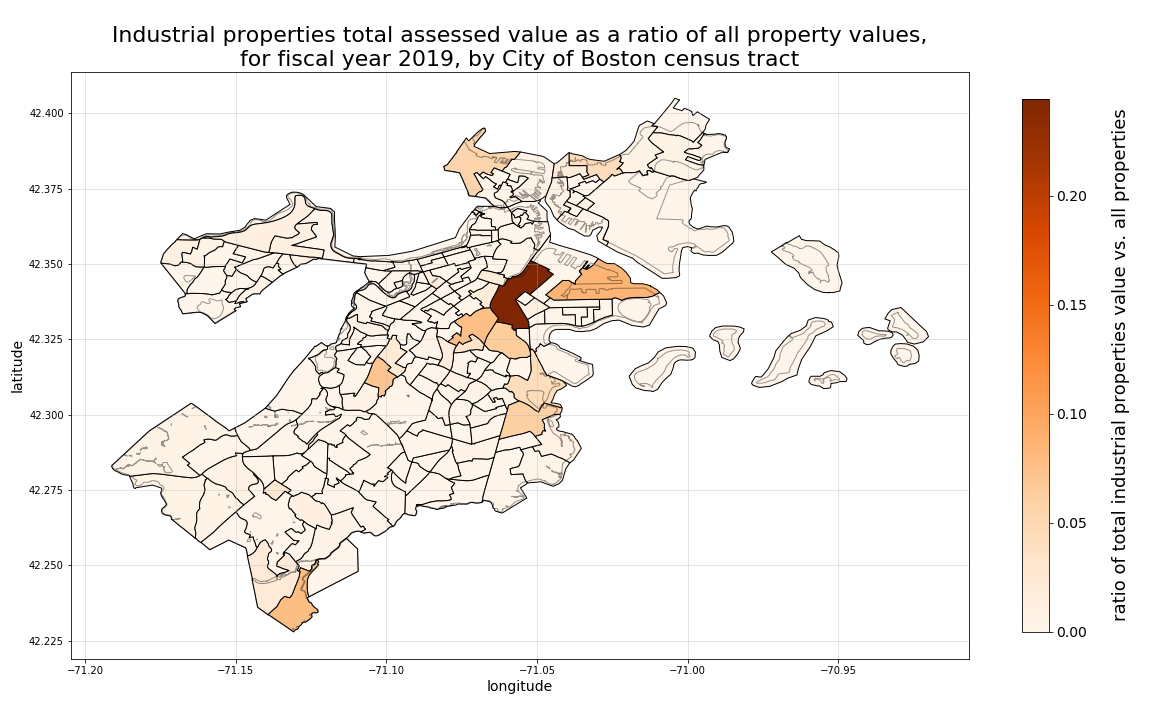
- Industrial properties mix ratio
- This provides a measure as to how “industrial” the corresponding census tract is, as measured by total assessed industrial property value in the tract divided by the total assessed value for all property in the tract during the given observation year.
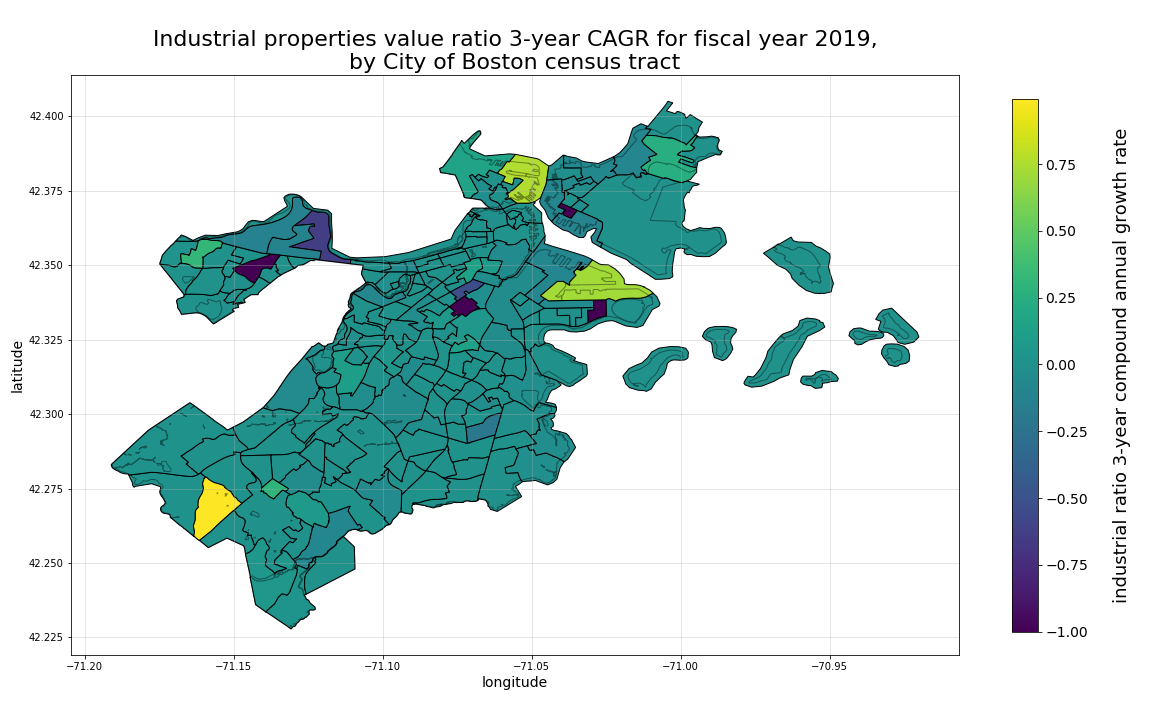
- Industrial properties mix ratio, 3-year CAGR
- This provides a measure of how much more or less industrial the tract is becoming at the time of the observation.
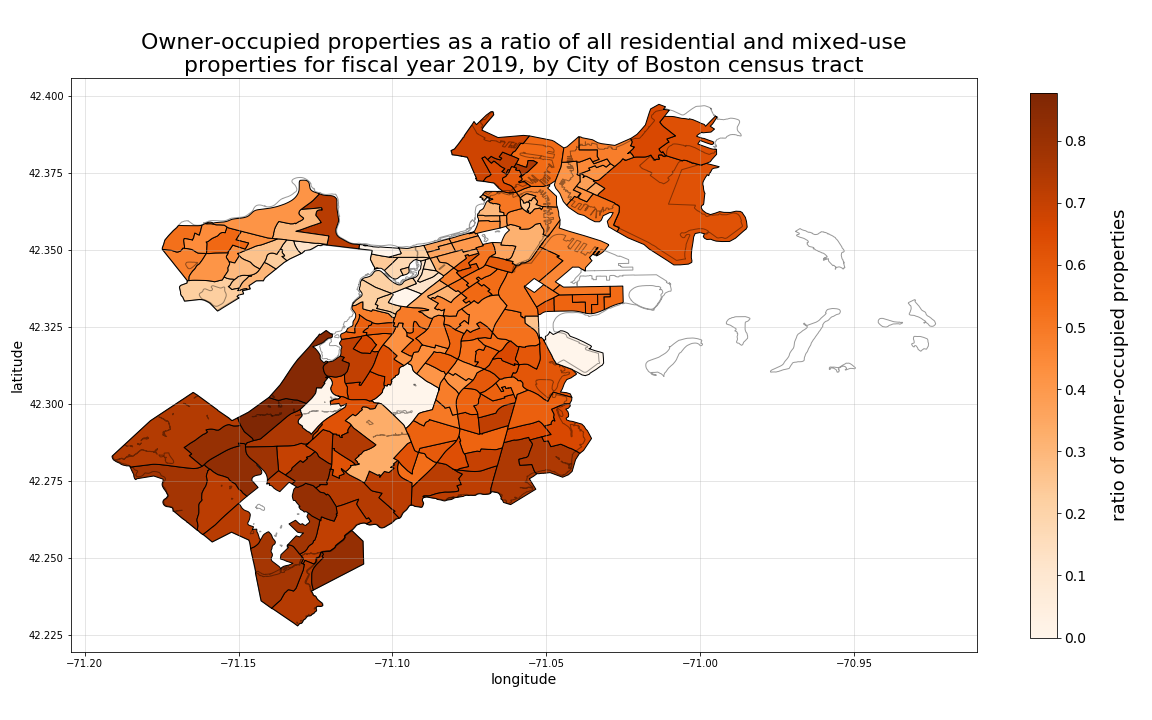
- Owner-occupied residential property ratio
- This is the proportion of the residential and mixed-use properties that are owner-occupied in each census tract during each given observation year.
- To a degree this acts as a measure of local ownership as well as a potential indicator of absentee property ownership at the census tract-level.
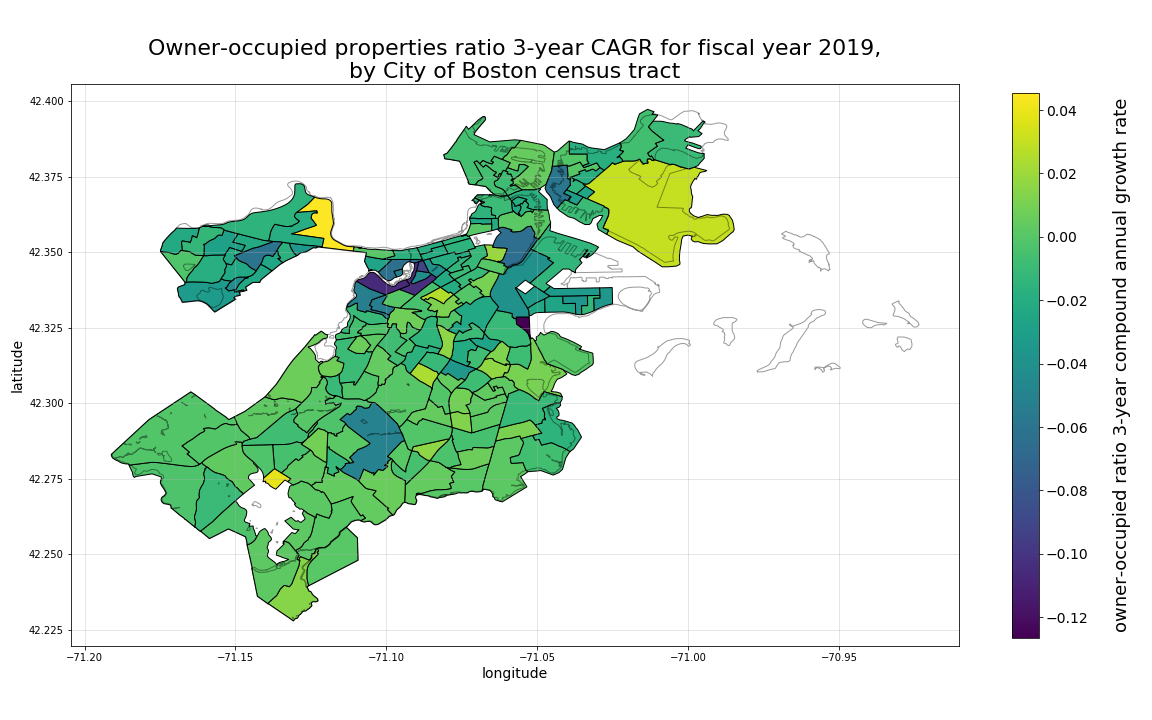
- Owner-occupied residential property ratio, 3-year CAGR
- Measures trend changes in local ownership for the census tract at the time of observation.
Engineered feature observations
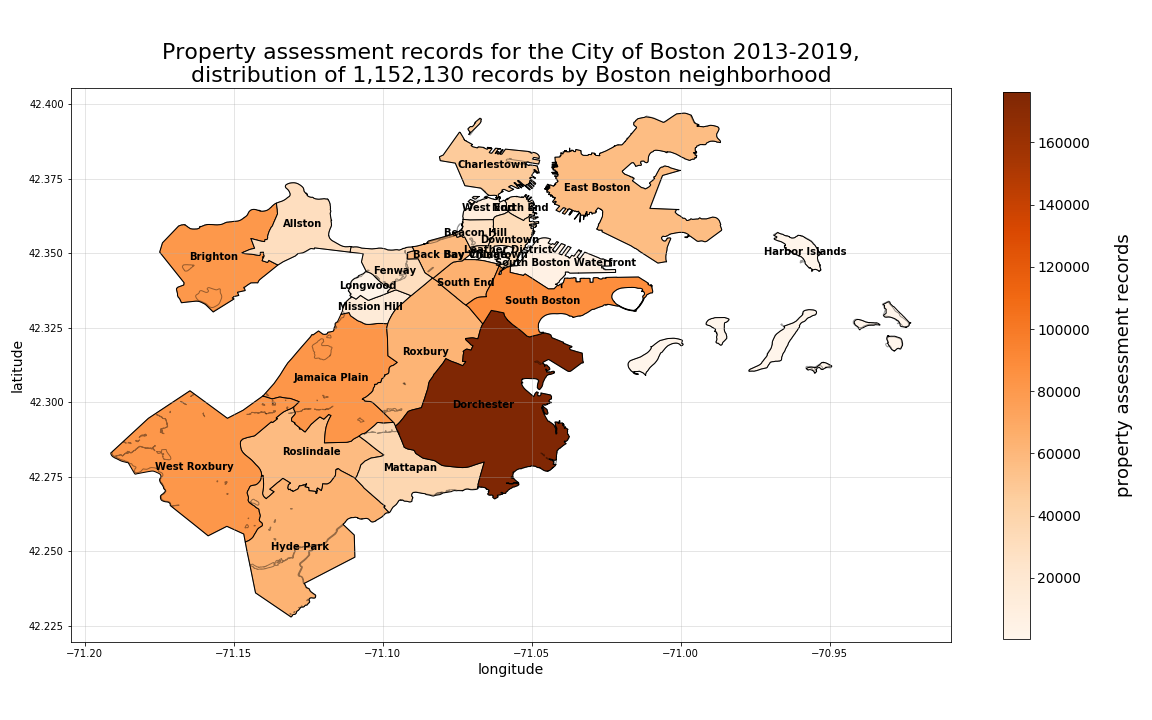
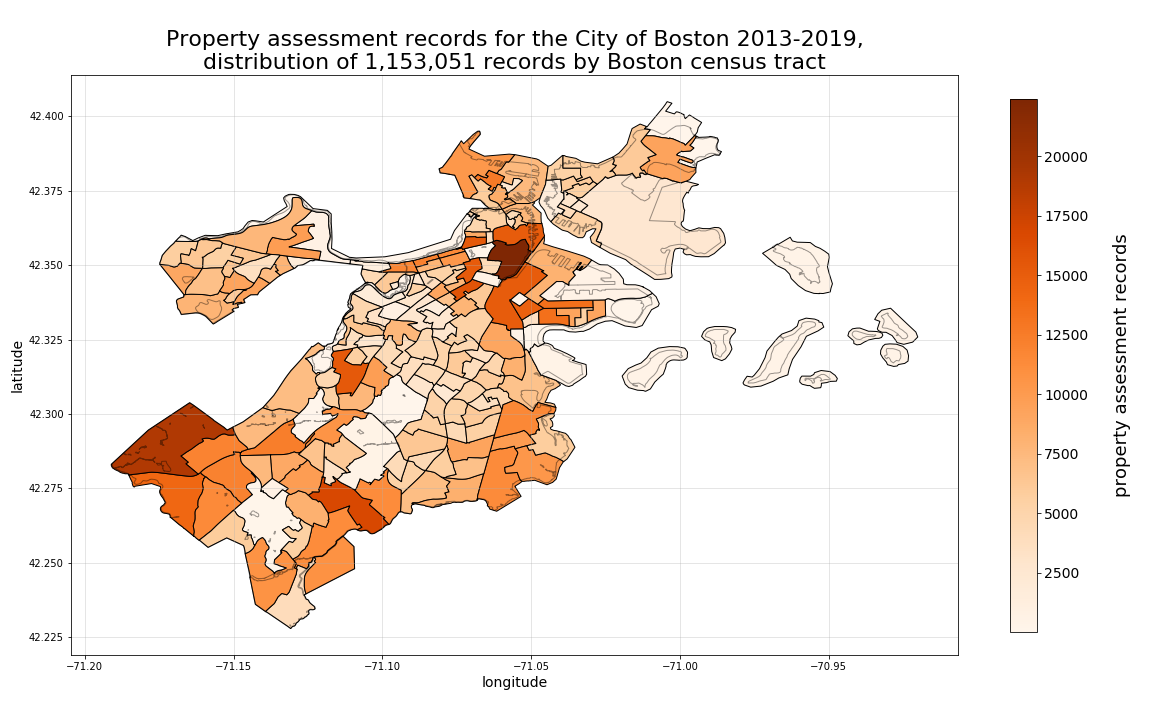
Shown below are a set of initial observations of the resulting tract-level engineered features, separated out by each respective 2019 point-in-time metric along with its corresponding 3-year change measure.
However, before drilling down to a feature by feature view of the data, it will be useful to first level-set the overall number of property assessment records as they are distributed among neighborhoods and census tracts. Note in the plots directly below, that similar to what we saw in the crime data evaluation shown here, we once again see the largest number of records distributed in Dorchester. Similarly, when we break down these distributions to the more granular census tract-level, we can see a change in overall distribution, with the expected high-density area located as a portion of the “Downtown” neighborhood, and surprisingly, another high density area in the western most tract of West Roxbury.
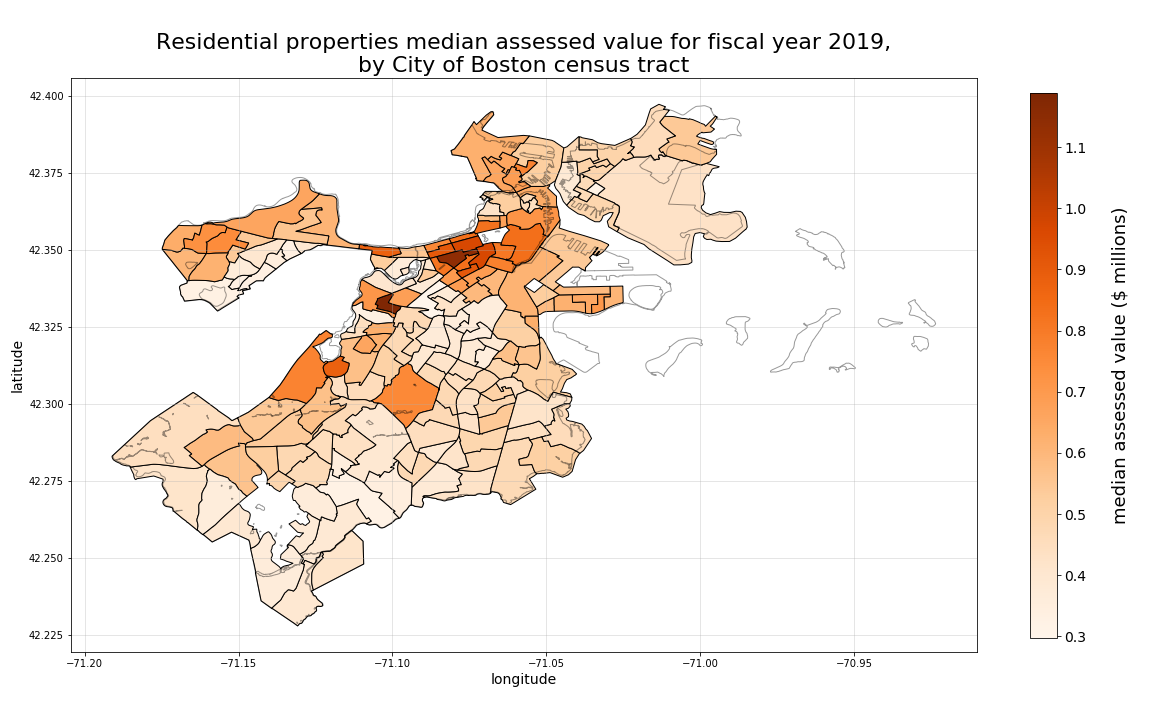
Median residential property value and 3-year CAGR
In the most recent year reported in the property assessment dataset (2019), the census tracts with the residential properties with the highest median assessed values appear to be heavily clustered in the Back Bay and Beacon Hill neighborhoods of the city, with a small additional pocket of high value residential properties located in one of the tracts corresponding with the location of the Longwood neighborhood.
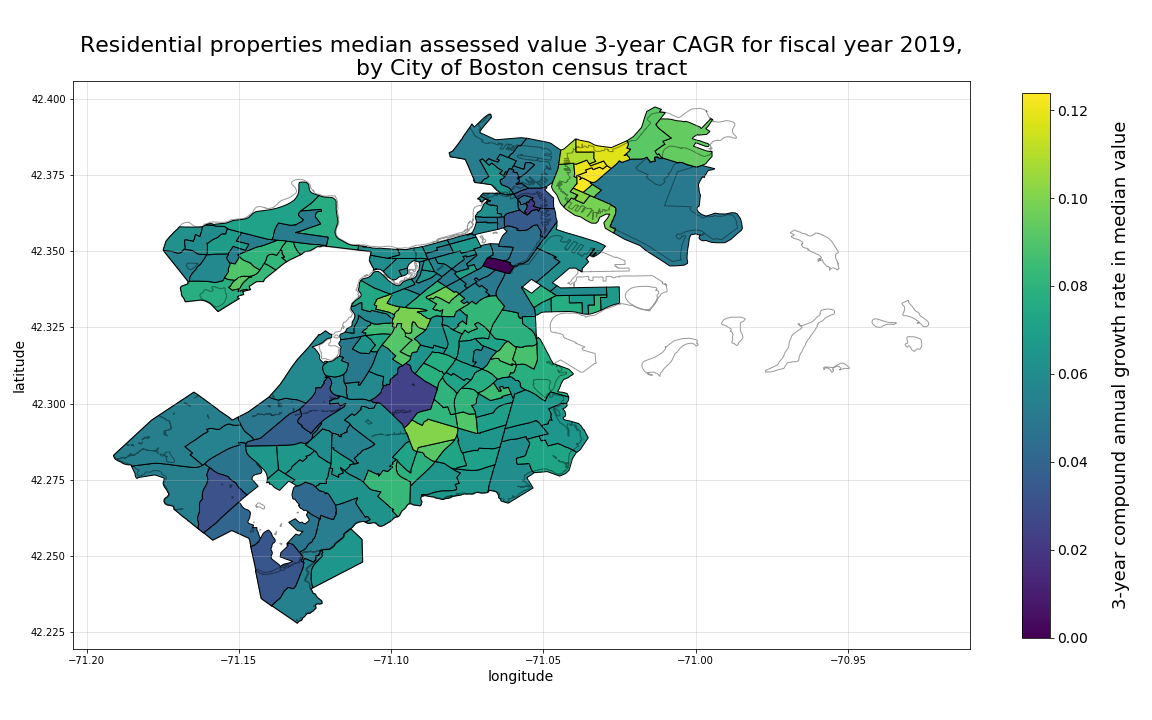
However, when we view the 3-year change in median assessed residential property values, we see a very different distribution (the second plot below). In that view of the data, we can see that the properties most rapidly growing in relative median value are located in the census tracts corresponding with the East Boston neighborhood, as well as few other areas of relatively high growth in Longwood, Mission Hill, as well as at the border of Roxbury and Dorchest. Interestingly, the high growth in some of these areas correspond with what we know to be high rates of gentrification and residential real estate development in some of these areas.
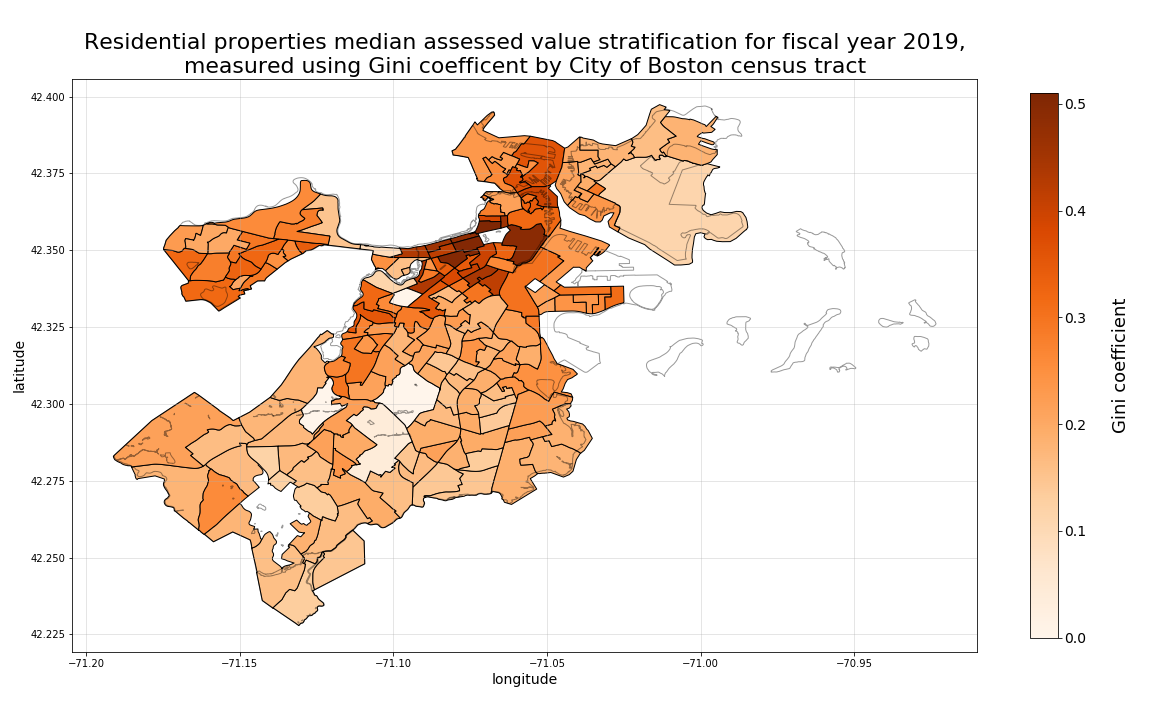
Median residential property value Gini coefficient and 3-year CAGR
As for inequality or disparity in residential median assessed property values, Back Bay and Beacon Hill both appear to have a high concentration of high Gini coefficient census tracts. This high concentraion also appears to spill over into Downtown, the South End, and the North End. However, when we look at 3-year changing trends in median value disparity (the second plot below), we see very distinct concentrations of high Gini growth in East Boston, Hyde Park, South Boston, and Allston census tracts.
Commercial properties mix ratio and 3-year CAGR
For commercial properties density, measured as the ratio of assessed commercial properties versus all properties by census tract, we can see high concentrations of commercial density in Back Bay and the South End along the area comprising the Newbury Street shopping district, in Downtown, as well as in the far northern edge of East Boston.
In terms of shifting trends in commercial density among census tracts in Boston (the second plot below), the Waterfront and South Boston area nearest to the Waterfront clearly stands out as the area of greatest commercial development.
Industrial properties mix ratio and 3-year CAGR
For industrial proprties density, measured similarly to the commercial density metric described in the section above, the western most boundary of South Boston clearly stands out as the area with the greatest relative density of industrial property. However, when it comes to recent changes in industrial density among all census tracts, the North End, Waterfront/South Boston border, and a single tract toward the southern border of West Roxbury stand out as the fastest growing. While pockets in Allston, Brighton, East Bston, the South End, and South Boston appear to be becoming less industrially concentrated.
Owner-occupied residential property ratio and 3-year CAGR
Lastly, in terms of owner-occupied residential and mixed-use properties throughout the City of Boston, the highest levels of density appear to occur largely along the southern most neighborhoods of the city (Mattapan, Hyde Park, West Roxbury, Roslindale), as well as in the north in Charlestown. Also noteable is the high concentration of owner-occupied properties in the easter area of Allston, and area where the proportion of owner-occupied properties has been rapidly growing over the prior three years (as is shown in the second plot below). Areas of Longwood and Fenway appear to be decreasing most rapidly in owner-occupied residential and mixed-use properties.