City of Boston Crime Incidents Data
Source materials
Here is a list with links to the jupyter notebook and original dataset used to generate the findings on this page:
Summary and challenges
The City of Boston’s crime incident reports (August 2015 - to date) data is the source data for the parameter of interest in our analysis, “crime type”. The original dataset managed by the City of Boston contained 436,666 crime incident observations, spanning 66 different crime “offense code groups” across the City of Boston.
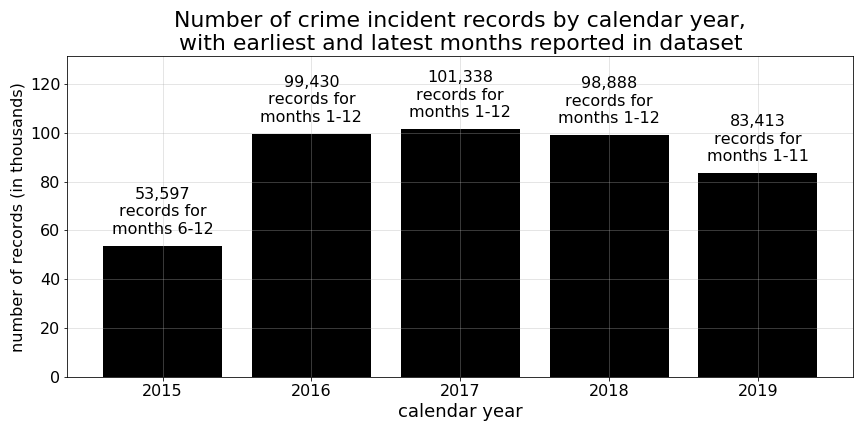
Due to limitations imposed by years of available property assessment data (for details concerning the property assessment data used in this analysis, please see this page), and the limited number of 2015 observations, we decided to use incident reports for just the 2016-2019 calendar years. Because of the geospatial nature of our analysis, we also excluded 35,785 additional records with missing latitude and longitude coordinates. And, due to a disproportionately large proportion of records during the final 3 months of observations (Sep.-Nov. 2019) with missing coordinate data (100% missing for Oct.and Nov. and >12% for Sept.), those three months were excluded as well. By subsetting our data to Jan. 2016 through Aug. 2019, and excluding observations with missing coordinates, we were left with 347,284 crime incident observations from which to work.
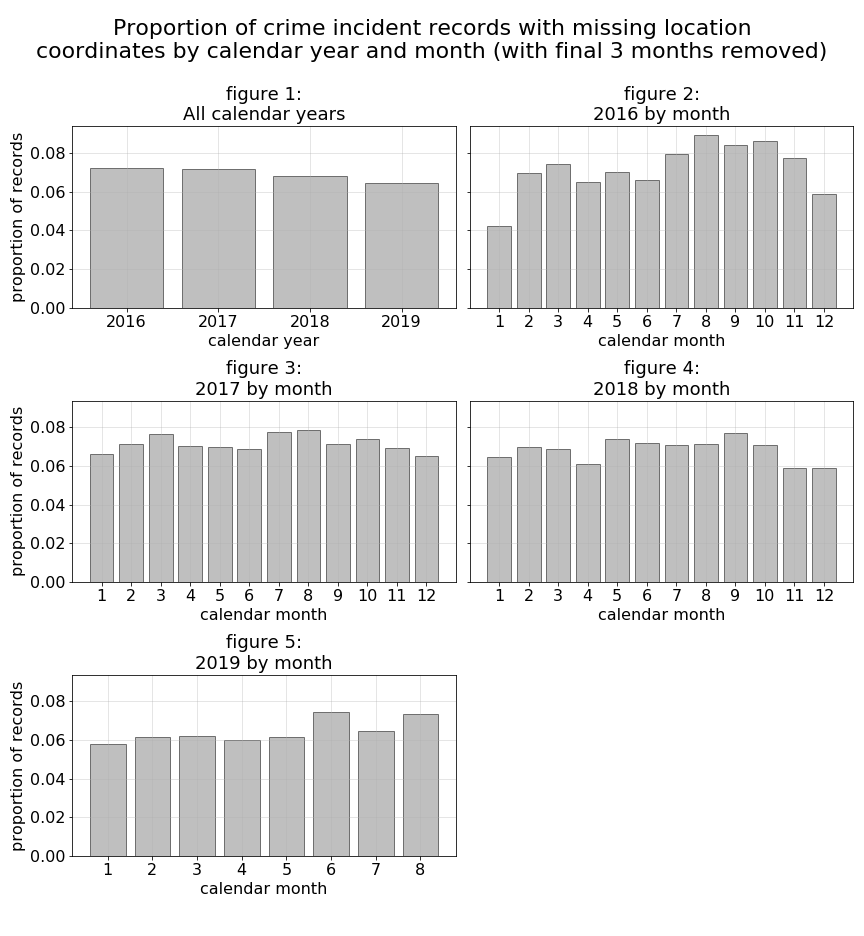
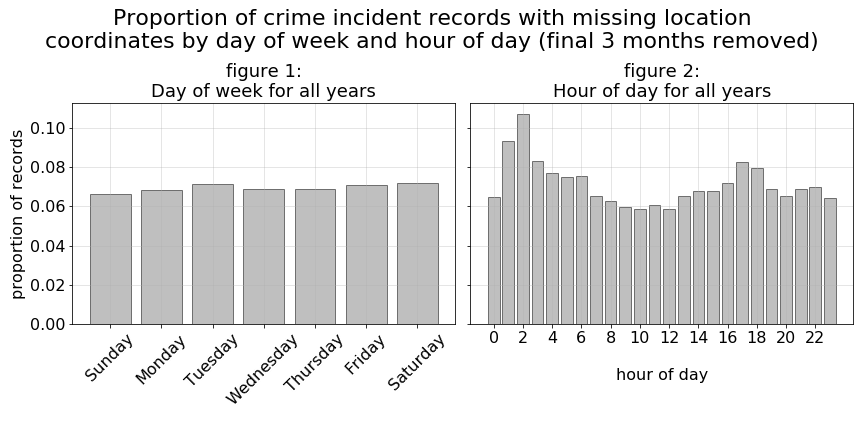
For reference, during the Jan. 2016 through Aug. 2019 period of time we keep for our analysis, below are a set of plots illustrating proportion of records with missing geo-location coordinate data. These charts demonstrate a fairly even distribution of proportions across the different plotted features. The biggest exception are crime records generated during the early morning hours of 1 a.m through 3 a.m. For this reason, we should note that early morning crimes during this period will be slightly under-represented in our resulting prediction model and subsequent analysis.
Consolidating “crime type” classes
Because we are dealing with a classification challenge, we also felt it was important to consolidate our 66 offense code groups into a smaller subset of “crime types” to generate more meaningful results later in our analysis.
A sampling of the original 66 crime OFFENSE_CODE_GROUP categories is shown below:
                                           RECORDS_WITH_COORDS
OFFENSE_CODE_GROUP
burglary - no property taken                                 3
commercial burglary                                       1376
other burglary                                             454
residential burglary                                      5324
drug violation                                           16044
operating under the influence                              484
confidence games                                          3235
counterfeiting                                            1591
embezzlement                                               339
fraud                                                     6965
criminal harassment                                        113
disorderly conduct                                        2501
harassment                                                5003
landlord/tenant disputes                                  1135
...                                                        ...
...                                                        ...
...                                                        ...
To accomplish our consolidation of crime-type class groups, we:
-
Removed incident categories of little interest that might otherwise obscure trends in more important areas of crime (for instance ambiguous categories like “investigations” or non-crime categories like “motor vehicle accident response” were omitted) and
-
Consolidated the remaining categories into a set of 9 different “crime types”:
- other
- burglary
- drugs-substances
- fraud
- harassment-disturbance
- robbery
- theft
- vandalism-property
- violence-aggression
For a sense of how these new consolidated crime types mapped to the original OFFENSE_CODE_GROUP categories, please refer to the partial match list below or view our entire crime-type matching key available online here:
                                                    RECORDS_WITH_COORDS
CATEGORY               OFFENSE_CODE_GROUP
burglary               burglary - no property taken                   3
                       commercial burglary                         1376
                       other burglary                               454
                       residential burglary                        5324
drugs-substances       drug violation                             16044
                       operating under the influence                484
fraud                  confidence games                            3235
                       counterfeiting                              1591
                       embezzlement                                 339
                       fraud                                       6965
harassment-disturbance criminal harassment                          113
                       disorderly conduct                          2501
                       harassment                                  5003
                       landlord/tenant disputes                    1135
                       phone call complaints                         40
                       restraining order violations                1785
                       verbal disputes                            15702
other                  aircraft                                      43
                       arson                                         93
                       assembly or gathering violations             832
...                    ...                                          ...
...                    ...                                          ...
...                    ...                                          ...
Summarized, the remaining records for each consolidated crime-type category are:
                        RECORDS_WITH_COORDS
CATEGORY
other                                  8084
burglary                               7157
drugs-substances                      16528
fraud                                 12130
harassment-disturbance                26279
robbery                                4317
theft                                 43770
vandalism-property                    17360
violence-aggression                   26945
Spatial distribution of remaining crime records
Once we dropped unused offense codes as well as all records with missing geo-location coordinates, we were left with 162,570 records for our analysis, distributed as shown below:
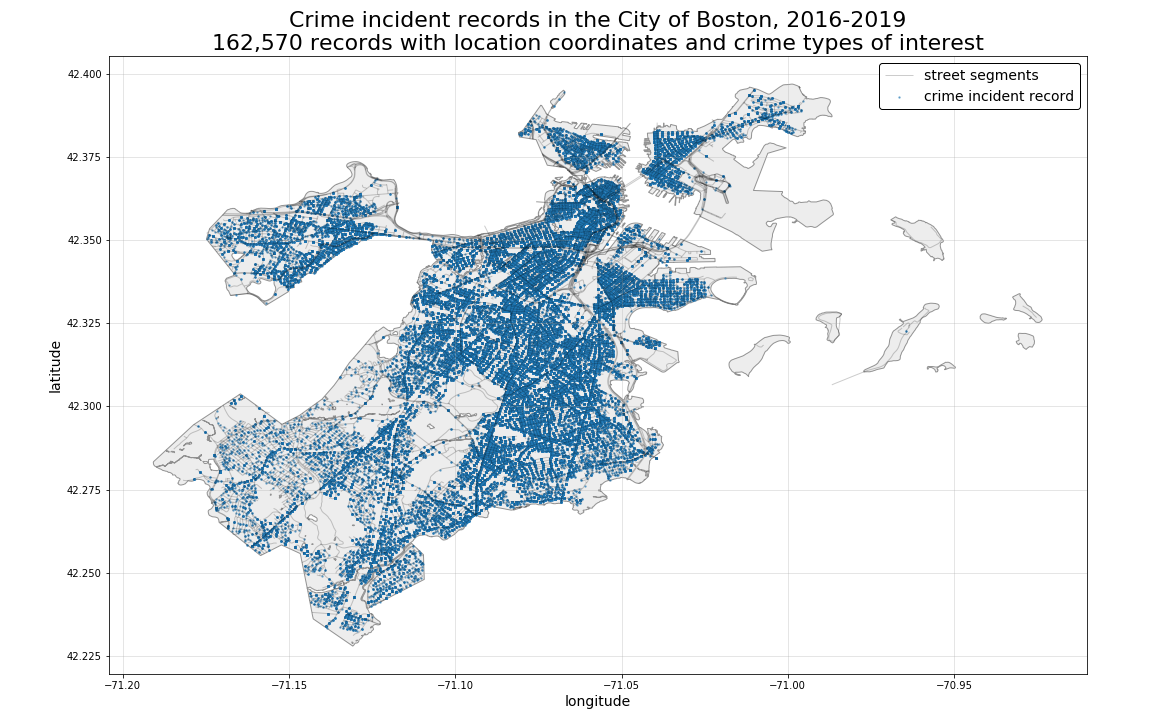
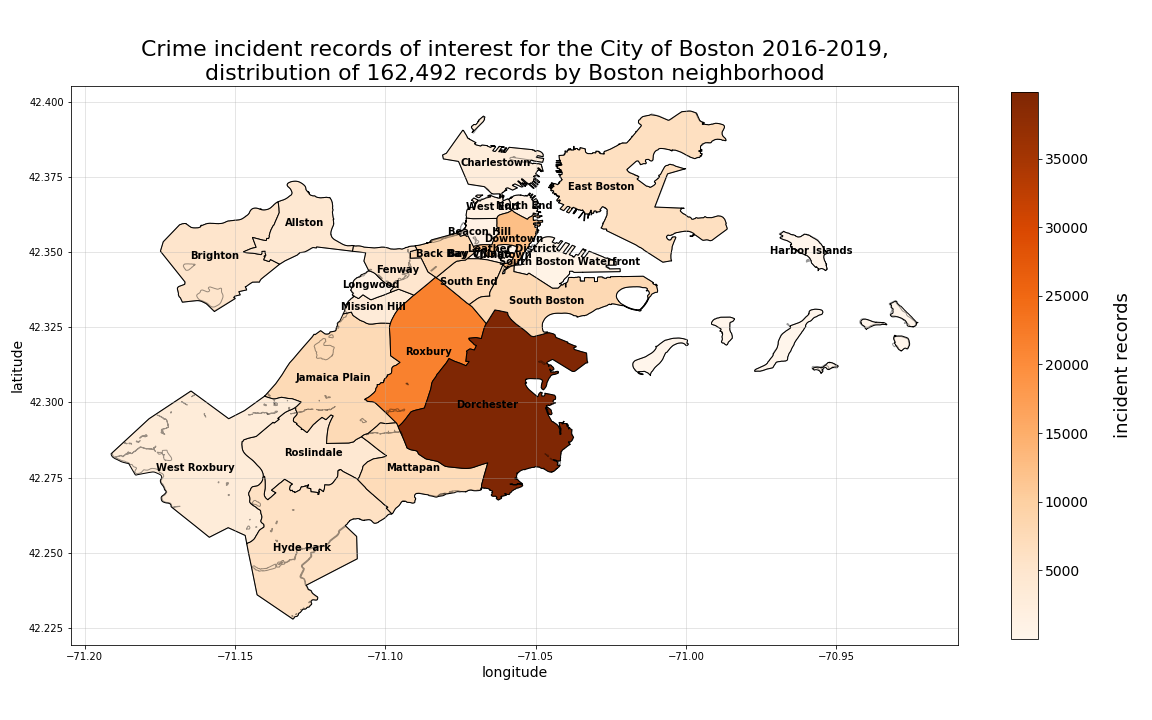
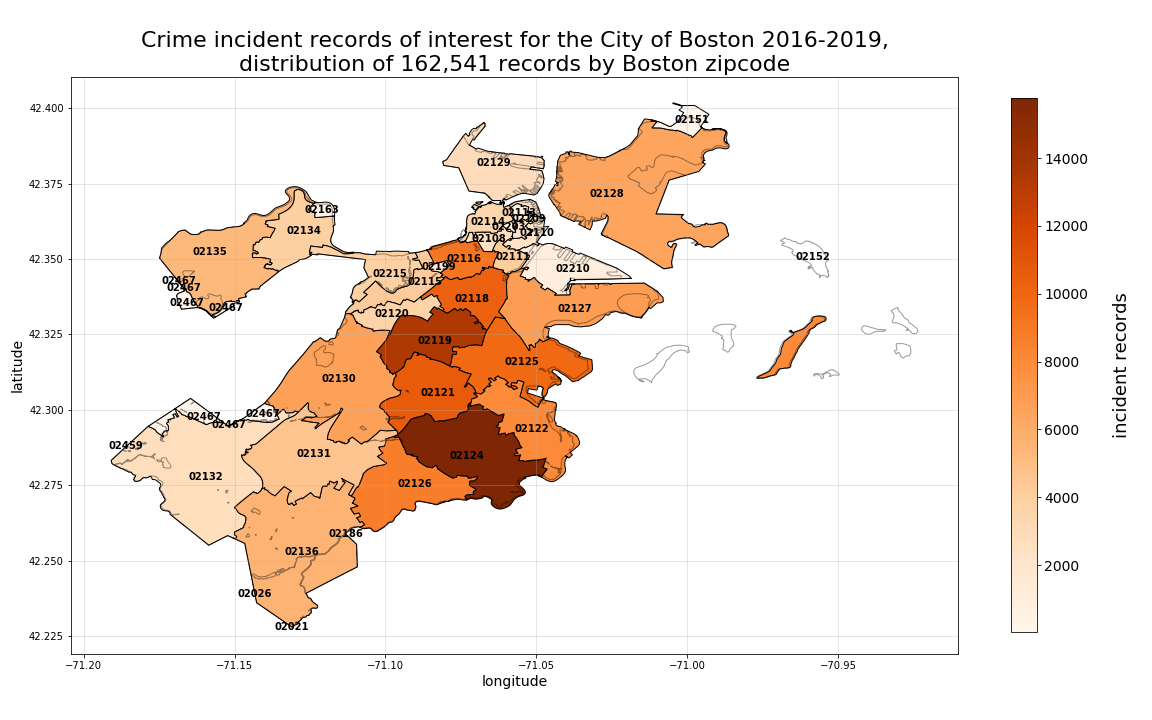
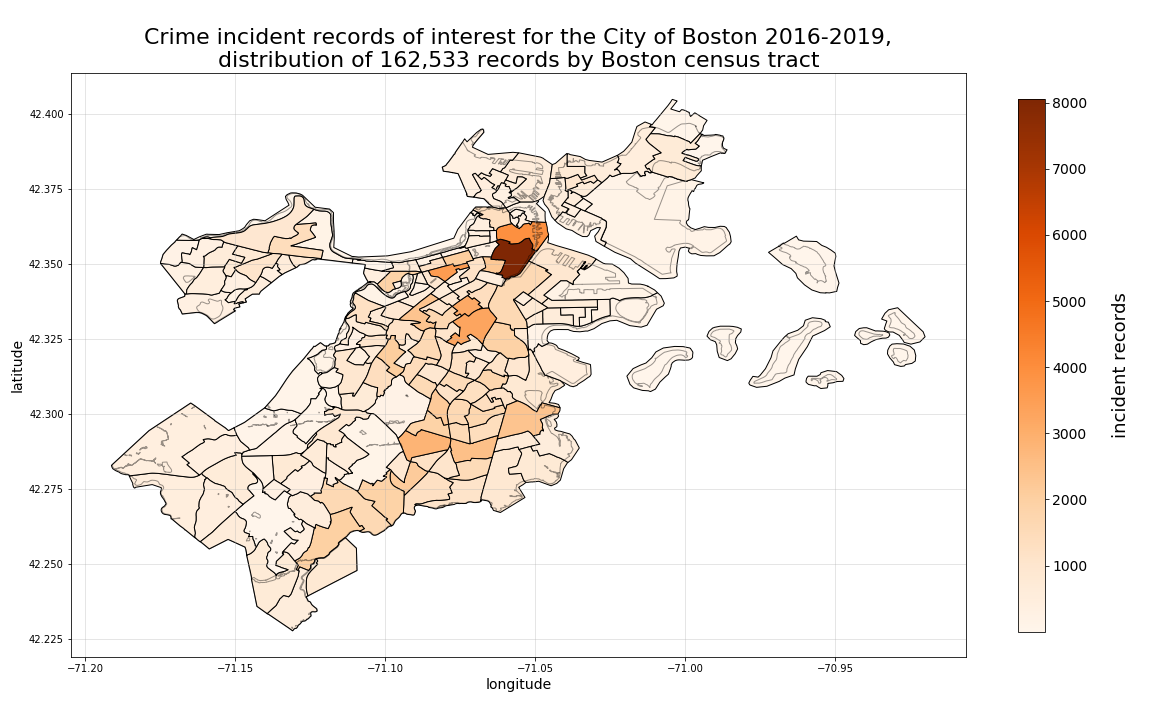
When we plot these records as distributed among their respective neighborhood, zipcode, or census tract, we can better visualize how the records are distributed spatially. What is interesting to note in the plots below, is how much greater the volume of crime incidents are for Dorchester versus all other Boston neighborhoods. By examining this same distribution by zipcode, we can see a slightly more even distribution of crime records. And, by further segmenting our distribution at the census tract-level, we can see a different “hotspot” for crime occuring in one of the tracts that Boston’s “Downtown” neighborhood would otherwise comprise. Also worth noting, is that by viewing the distributions by both zipcode and census tract, we can also see how Dorchester has such a disproportionate percentage of the overall records, with the fairly high concentration of crime records among the smaller segments Dorchester comprises as whole. Please also note (based on the total number of records reported in the title of each plot below) that not all crime records with coordinates match to specific neighborhood, zipcode, or census tract perimeters. Therefore, each of those record counts vary slightly from the overall 162,570 remaining in the total dataset.
Potential bias resulting from missing coordinate data
As a final note concerning the crime incident report record data we will be using to generate predictions further along in this analysis, it is also important to consider potential missing data biases resulting from our ommission of crime records with no corresponding geo-location coordinates.
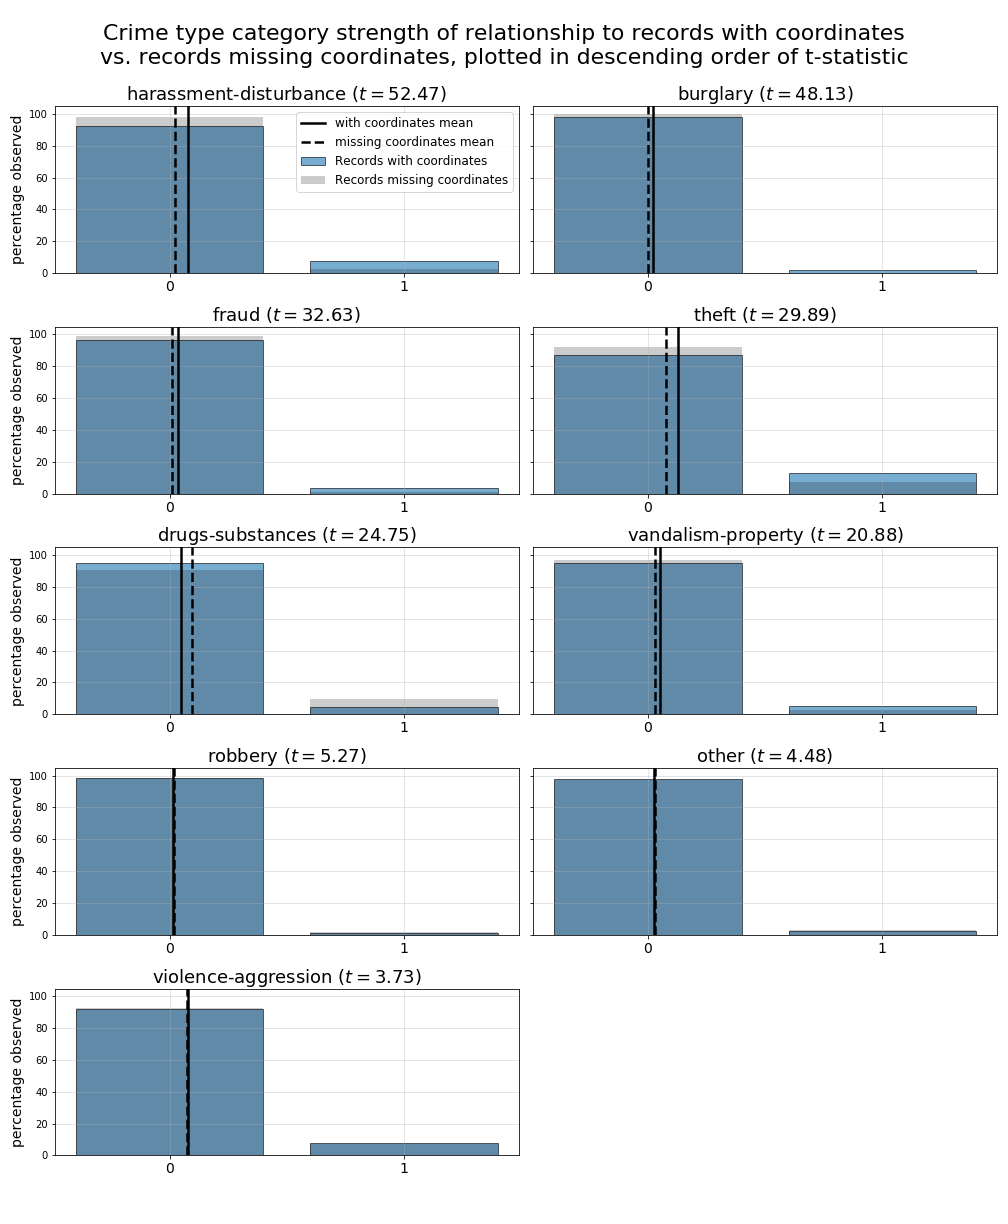
By generating t-statistics for each of our consolidated crime-type classes versus records with and without missing geo-location coordinates during the Jan. 2016 through Aug. 2019 period of time, we can begin to understand potential class-by-class relationships to the records we ultimately omit from our final dataset. Overall, based on these calculated t-statistics, it would appear the “harrassment-disturbance” and “burglary” type crimes are most closely related to the missingness of geo-location coordinates, with “violence-aggression” crimes being the least related as is illustrated in the table below.
Calculated t-statistics for each consolidated crime-type
class for missing vs. non-missing coordinate records are:

                          t-stat
harassment-disturbance    52.47
burglary                  48.13
fraud                     32.63
theft                     29.89
drugs-substances          24.75
vandalism-property        20.88
robbery                    5.27
other                      4.48
violence-aggression        3.73
While we do not yet have a solution for matching coordinates to the unmatched crime records, it is important to note this potential source of bias in our resulting analysis and prediction models. However, if we view the plotted proportions of records by class with missing and non-missing data (as is shown in the plot below), we can see the actual percentages vary only slightly even for the crime-type classes with the largest t-stats. Keeping this in mind, we will progress with the subsetted and cleansed crime records dataset described in the section above.