City of Boston Property Violations EDA
Source materials
Here is a list with links to the jupyter notebook and original dataset used to generate the findings on this page:
Summary and challenges
Over 18,000 property violations in the Boston area have been analyzed across 453 property violation types.
The most common property violation types include:
- “Unsafe and Dangerous” (17%)
- “Failure to Obtain Permit” (14%)
- “Owners Responsibility to Maintain Structural Elements” (8%)
Given that the remaining 450 property violation types cover the remaining 69% of all violations we may consider further feature engineering to simplify our violation types or exclude property violations from our models.
Distributions on Boston Map
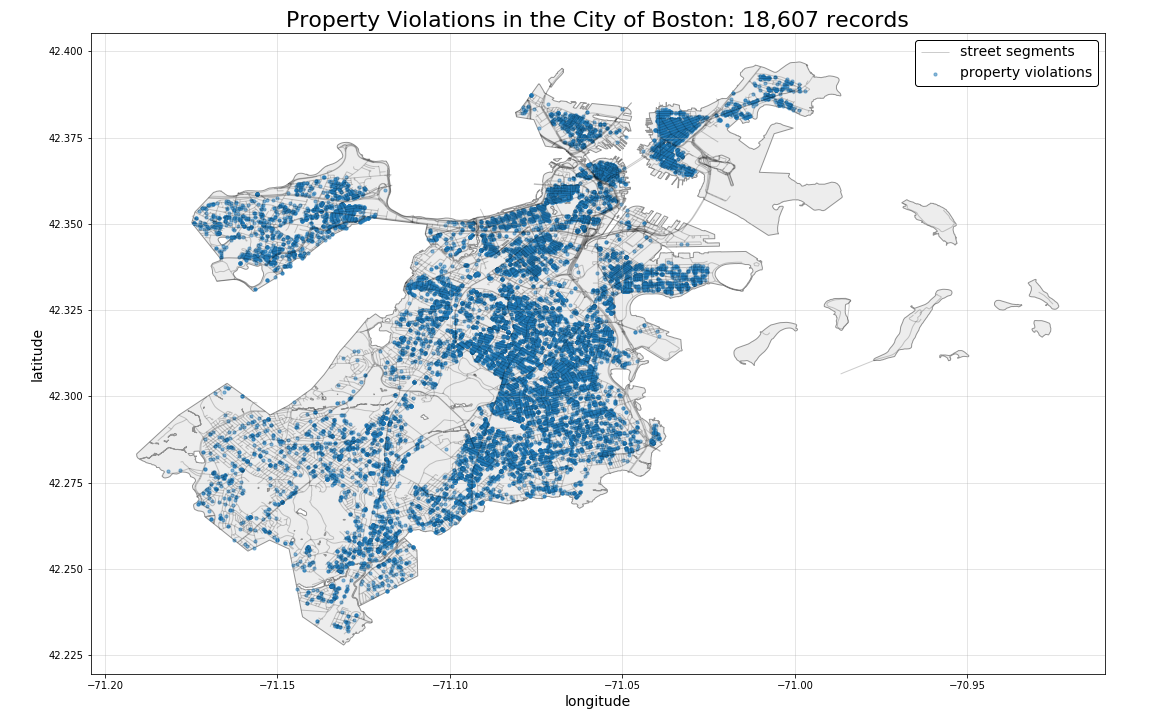
The plot below illustrates all property violations in the city of Boston.
